
Cori Pringle
What Happened to Linear?
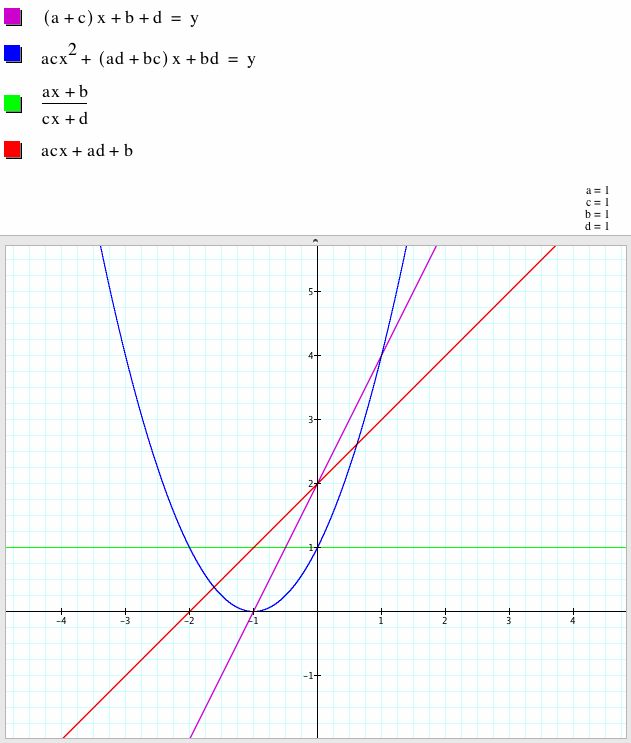
To begin this assignment, I selected two linear functions for f(x) and g(x). I then decided to generalize and use graphing calculator to see the differences while changing the nonfixed variables. I let
f(x)= ax + b
g(x) = cx + d
Therefore:
i. h(x) = f(x) + g(x) = the first equation in purple, which we can see is linear.
ii. h(x) = f(x) . g(x) = the second equation in blue, which we can see is quadratic.
iii. h(x) = f(x) / g(x) = the third equation in green, which appears linear, because it is currently equal to 1, but is actually an inverse function.
iv. h(x) = f(g(x)) = the fourth equation in red, which is linear.
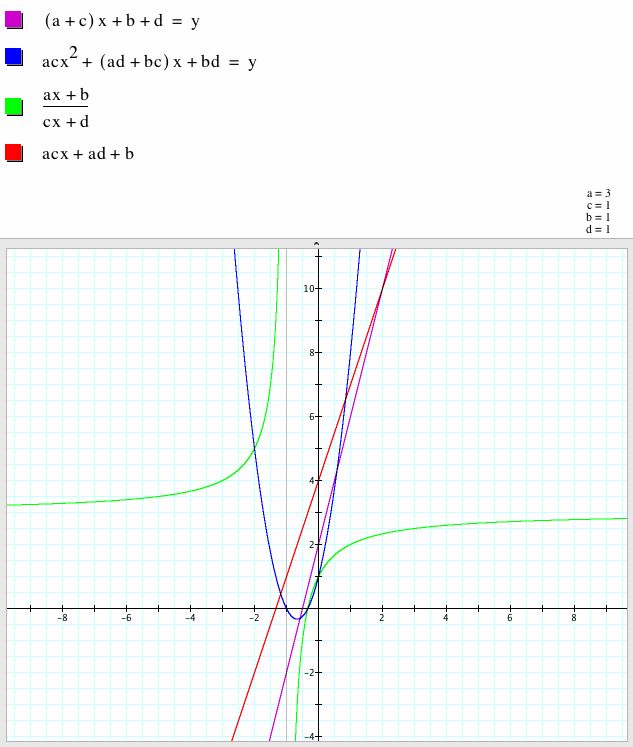
If we leave c, b, and d = 1, but change a to 3, we can see that the green function is a rational function, while the other three graphs stay linear, quadratic, and linear, respectively.
The purple equation still has it's y-intercept at (0,2), but the slope increases.
The blue equation has a vertical stretch and the vertex moves right and down a bit.
The green equation is a rational function with asymptotes at x = -1 and y = 3.
The red equation moves it's y-intercept from (0,2) to (0,4) and the slope increases.
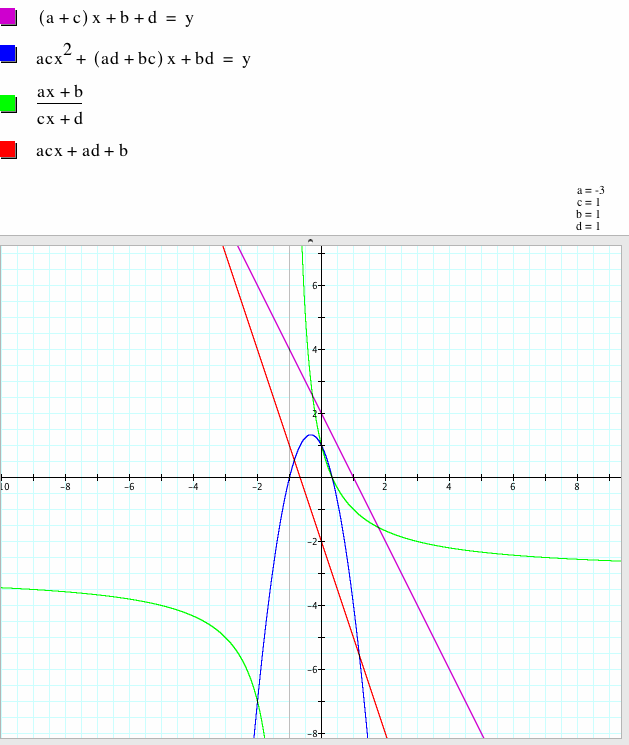
If we leave c, b, and d = 1, but change a to -3, we can see that all of the functions are reflected
The purple equation still has it's y-intercept at (0,2), but the slope is now negative.
The blue equation appears to reflect over the line x=1.
The green equation is a rational function with the vertical asymptote still at x = -1, but the horizontal asymptote is now at y = -3.
The red equation now has it's y-intercept at (0,-2) and the slope is negative.
What I find most interesting about these linear functions is that my middle school students would probably think that if we are working with linear functions, then we're going to have linear functions. When we add two linear functions this is true, as well as when we take a linear function of a linear function (f(g(x)). However, when we multiply two functions, which is a Math I GPS that we introduce to 8th graders with an area model multiplying two binomials, things change.
I have used the area model to show that we now have an x squared term, but I have failed to allow students to investigate this graphically. We study quadratics in 8th grade, but not directly with multiplying binomials. This year, I believe I will teach this a little differently. Showing the graph when we multiply two linear functions could solidify an understanding of functions in my students.
It would be my hope that this leads my students to the next step of wondering what happens when we divide two linear functions. Although we graph some rational functions, the major standard we are identifying in 8th grade is whether or not a function (or relation) is linear or nonlinear. However, by using Graphing Calculator, I think we could investigate this idea of dividing two linear equations and observing the graph. The algebra that goes along with this will be further investigated in Math I, but at least my children will gain a basic understanding and could certainly discuss transformations of both the quadratic and rational graphs.